Facebook Insights, Facebook’s social media monitoring tool, has made Facebook a top contender for digital marketing. With all kinds of data on likes, reach, and blog post analytics, this tool is a marketing goldmine. Best of all? You get tons of information at absolutely no cost. Here’s an overview of the different marketing tools available on Facebook Insights.
Overview
This tab is a quick peek at the most important trends for your page. It shows reach, page likes, and actions on page. What’s more, Facebook Insights gives percentage-based comparisons for each of these elements from today to 28 days ago. It also gives statistics for “Your 5 Most Recent Posts” as well as the top pages to watch, which are pages that are similar to yours.

Likes
The first individual tab features three graphs analyzing your likes. The first graph shows your total page likes. This allows you to see the fluctuation of your total page likes and, as you drag your mouse across the graph, the total individual page likes for each day.
The next graph shows your net likes, which is the number of new likes minus the number of unlikes. With this graph, you can see whether your page’s new likes are positive or negative.
Likes can come from plenty of places. Maybe someone was visiting your page when they clicked “Like;” maybe they stumbled across one of your posts, or were led to you by Facebook suggestion led them to you. The final graph shows where your page likes came from. Being able to tell where your traffic is coming from is important; if you notice your likes are only coming from suggestions, you can focus efforts on bringing users to your page.
If the graphs look too cluttered, you can view each of the categories individually. The range of dates for each graph can be changed to the past week, month, quarter, or you can choose a custom range of dates.

Reach
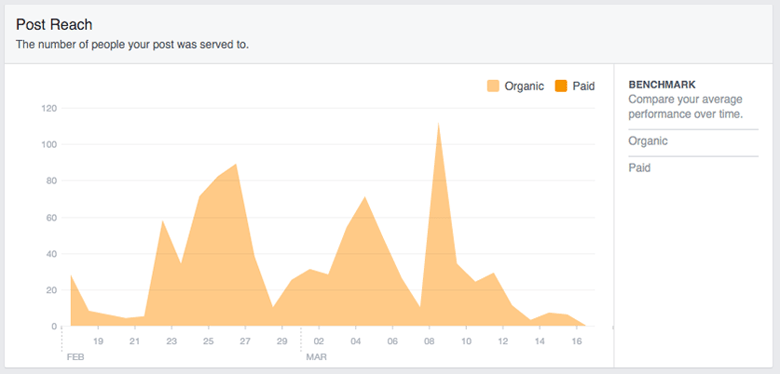
Reach measures the number of people your post was served to. The first graph shows your total post reach every day for the range of dates requested. You can filter this graph between organic and paid posts. The second graph shows how many reactions, comments, and shares your posts received every day. The next graph shows the number of users who hid your posts, hid all posts, reported your posts as spam, and unliked your posts. You can use these graphs to measure not only the positive, but also the negative aspects of your reach so you can know what to change.
The last graph on the page shows total reach. This is the number of people who were served any activity from your page including posts, posts to your page by others, page like ads, mentions, and check-ins. Just like the “Likes” page, the range of dates for all of the graphs on this tab can be changed.
Page Views
Here, you can see total views, total people who viewed, and a list of top sources. The total views graph shows the number of times your page was viewed in a day. You can also break this graph down by section: home, timeline, about, photos, likes, and other. The second graph shows the total number of people who viewed your page on that date. This graph can be filtered by the aforementioned sections and includes age, gender, country, city, and device. The date range for these graphs can also be edited.
Actions on Page
This page analyzes the actions that viewers take while on your page. The first graph gives the daily number of get direction clicks, phone number clicks, website clicks, and call-to-action clicks. Each can be filtered by dragging your mouse over the perspective category above the graph. Below this graph are individual graphs for the following categories: ages, gender, countries, cities, and devices that clicked on the action.
Posts
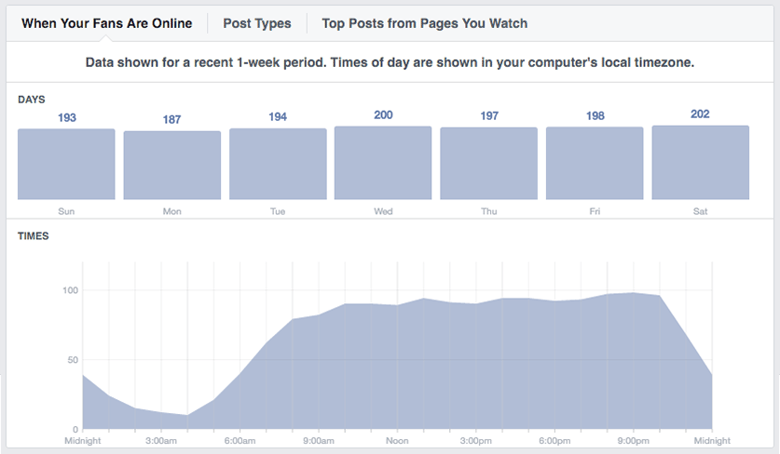
The post tab contains some of the most important information Facebook Insights has to offer. A bar graph shows the number of your fans who log in to Facebook each day of the week. Below is a graph showing how many fans are on Facebook at different times throughout the day. These two graphs show the most optimal days and times to post content. You can also view the average reach and average engagement for all of your different post types including photos, links, and shared videos. The reach can be filtered to show the amount of fans versus non-fans that viewed your post. This can give a good idea as to which posts are getting shared and attracting viewers who don’t already like your page. This tab is vital to improving your Facebook presence. You can view which specific posts are doing well and use those as templates for future posts.
Videos
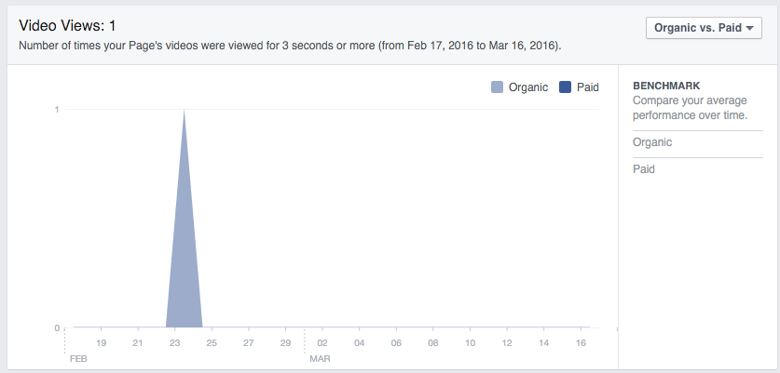
This tab analyzes your video posts on Facebook. The first graph shows the number of times your pages’ videos were viewed for three seconds or more. The second graph shows the number of times your pages videos were viewed for 30 seconds or more. If a video is shorter than 30 seconds, it counts when people view 97 percent of it. Both of these graphs can be filtered between organic and paid; auto-played and clicked-to-play; and unique and repeat.
People
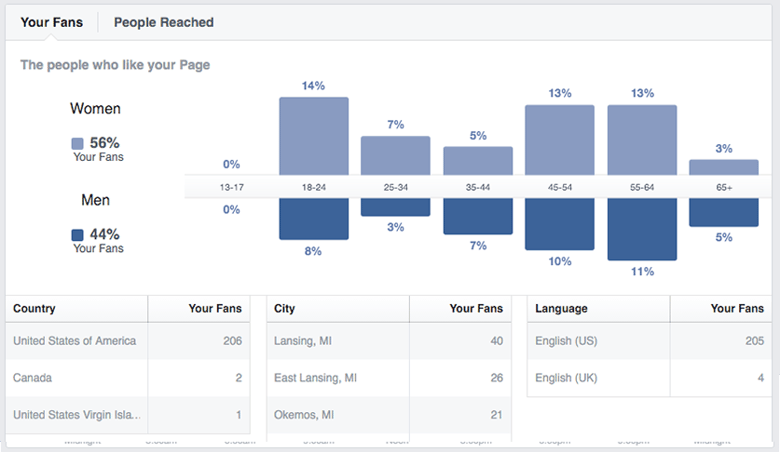
This tab gives the breakdown of the age, gender, and location demographics for your fans and people reached. This is important to pay attention to in order to make sure you’re targeting the right demographics. Make sure these statistics match up with your buyer personas. If not, make changes in order to cater to the right demographic.
Facebook Insights is a marketer’s analytics heaven. Make sure you capitalize on this free social media monitoring tool. Use it to optimize your Facebook and target your consumers effectively.
For more tips, check out our introduction to social media monitoring. Want another free social media tool? Our social media planning template is available for download below:
Topics: marketing


